|
Forex Charts
There are 3 ways to display forex charts in TradingDesk Pro 5 system.
1. To get Forex Charts fame press right mouse button in any (empty or full) frame of the screen and select "Assign View" in the shortcut menu. In the window "Choose view template" select "Chart" and press "OK".
2. Actuate a fame (press left mouse button in the fame and to headline of frame will become blue) and select View => "Chart" in the main program menu.
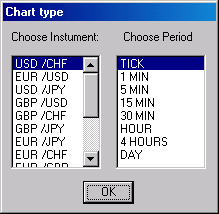
After making these steps you should select chart parameters in the following "chart type" window:
In this window user should select currency pair and chart timeframe (time period) for a new forex chart and press Ok.
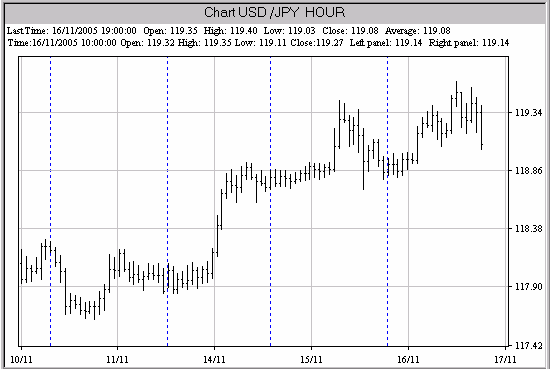
Forex Chart frame has the following appearance:
Chart frame structure
1. Heading of the frame reflects ~ currency pair ~ and ~ timeframe ~ of the chart. TradingDesk Pro 5 system supports the following forex chart timeframes: tick (single quotes), 1 minute (1 min), 5 minutes (5 min), 15 minutes (15 min), 30 minutes (30 min), 1 hour (1 H), four hours ( 4H), one day (Day). Amount of values in the chart is 560. Thereby it is possible to build charts with the temporary size nearly from 47 minutes on tick timeframe to nearly 1.5 years on daily timeframe.
There are 2 lines under the heading of the Forex Chart frame called Title Bar.
Upper line of Title Bar reflects last bar of timeframe: time of last bar (or candle) in DD/MM/YYYY HH:MM:SS format (for tick timeframe time of last tick is used), open price (average from bid and ask), highest price (ask), lowest price (bid), close price (average from bid and ask). Lower line of Title Bar reflects the current values of time slot at mouse cursor position: time of current bar of time slot in DD/MM/YYYY HH:MM:SS format (for tick timeframe time of current tick is used), open price (average from bid and ask), highest price (ask), lowest price (bid), close price (average from bid and ask), left panel horizontal value (horizontal coordinates) and right panel horizontal value (price if mouse cursor is located on the price chart and indicator value if mouse cursor is located on the indicator Sub Window.
Forex Chart body is located below and consists of - Chart body - Left panel (ordinate axis) - Right panel (ordinate axis) - abscissa
User can make unlimited number of chart frames on one screen.
Changing of instrument (currency pair) on the chart is realized by making new chart at the scene of old chart as indicated above. Changing of time can be made by pressing timeframe buttons under the main program menu.
How to change forex chart options is written in the next section of this help.
|

